

© All content copyright NBR. Do not reproduce in any form without permission, even if you have a paid subscription.
The term "Housing Crisis" has been the standard text of many news articles in the past week - a quick Google search reveals the extent of the coverage and the political mud-slinging. Now, whether or not there really is a crisis regarding the availability of houses, or if we are seeing a bubble in property prices, is always a matter best explained and rationalised after the event, never during it. This leads me to ponder the old adage of "What can we learn from examining history?" and equally the wise comment "Past history is not a certain predictor of future trends".
However, despite these cautionary words it is useful to examine the history of property data, in the context of which, history covers in relative terms a fairly short period; for accurate factual data of property selling prices only goes back to 1992. Since that time we have had a monthly median sales price reported by the Real Estate Institute; that's 22 years of data which does at least cover a couple of key cycles, most significant of which in price terms was the period from 2000 to 2009. During this period of 9 years we saw the national median price (measured on the Stratified House Price Index) to more than double from $174,850 to $344,566. (See graphs below - click to zoom)

The key question is whether the current bull market witnessed since 2009 is in any way a repeat of history? Certainly that slope looks very similar and can be seen to some extent to be accelerating over the past year.
To attempt to answer this question, I have compared on an index basis these two periods and overlaid them on the same chart. For the national picture the chart below tracks these two periods with the 2000 - 2009 period represented by the grey line and the recent 2009 to date represented by the red line.

Into the 5th year of this bull run the national median sales price is up 21%, this compares with a rise of 52% over the earlier property bull run at the start of the last decade. A case of the circumstances looking similar but actually the extent of the rise being nothing like as significant.
However when I thought more about this analysis a question struck me, which is as to whether indexing is appropriate a measure after all a 10% increase on $200,000 is $20,000 whereas a 10% increase on $400,000 is $40,000 and I know which capital appreciation I would prefer to have. So to answer the question, the capital appreciation over the early part of the last decade representing that 52% increase was $91,250 and the most recent rise of 21% represents an appreciation of $77,821. The chart below more ably demonstrates this.

So there appears to be a lot of similarity in capital gain between the current bull run and the last bull run - half way through the cycle if history were to be repeated, it would seem.
However, this is where the rich data available can provide a very different view as to forecasting the coming years as to whether future capital appreciation will match the past decade. For although the national picture shows a striking similarity in capital appreciation thus far the components of the key regional markets highlights a very mixed story.
The REINZ Stratified House Price Index only covers the main three metro areas and then provides a figure for the North Island (minus Auckland and Wellington) as well as the South Island (minus Christchurch). Here below are these respective analyses of capital appreciation for the period of 2000 to 2009 and 2009 to date across these metro and provincial areas.
Auckland
Auckland we all know is cited as the driver of the current NZ property bull market, but would you have imagined for a moment that it is outstripping the performance of the last bull run? In just over four years the capital appreciation of the median sales price is $198,355; after the same period at the start of the last decade it was $132,810. There was certainly a hesitant start but that capital appreciation has been rolling along at a fair clip for the past two years - those two lines are certainly diverging more and more.

Wellington
It probably comes as no surprise to hear that the capital appreciation for the Wellington market is less than Auckland, however the extent to how much lower may surprise. After just over four years the capital appreciation of the median sales price in Wellington is $28,582; after the same period at the start of the last decade it was $84,035. You could, looking at the chart even question the security of that accumulated capital appreciation - just four months ago it amounted to $65!

Christchurch
The Christchurch market, very much as a result of its own set of unique circumstances has been cited as the partner to the Auckland market in driving the bull run of house sale prices nationally. Well the data certainly bears that out, not quite as extreme as the Auckland market but keeping very much inline with the last bull run. After just over 4 years the capital appreciation of the median sales price in Christchurch is $107,982; after the same period at the start of the last decade it was $92,185.

Other North Island
This set of data comprises what remains of the North Island excluding Wellington and Auckland which is a large part of the North Island property market. It does cover the Waikato region including Hamilton as well as Tauranga, the Hawkes Bay, Taranaki, Northland and Manawatu / Wanganui, a very diverse range of property markets. It will though come as no great surprise to see that these collective markets being more of provincial New Zealand, have not experienced a bull market for the past four and a half years. Over this period the capital appreciation of the median sales price across these provincial North Island centers is $16,820; after the same period at the start of the last decade it was $67,225. There is certainly a lot of similarity between the Wellington market and the rest of the North Island excluding Auckland, further reinforcing the fact that this bull run is very centric to the two major cities.

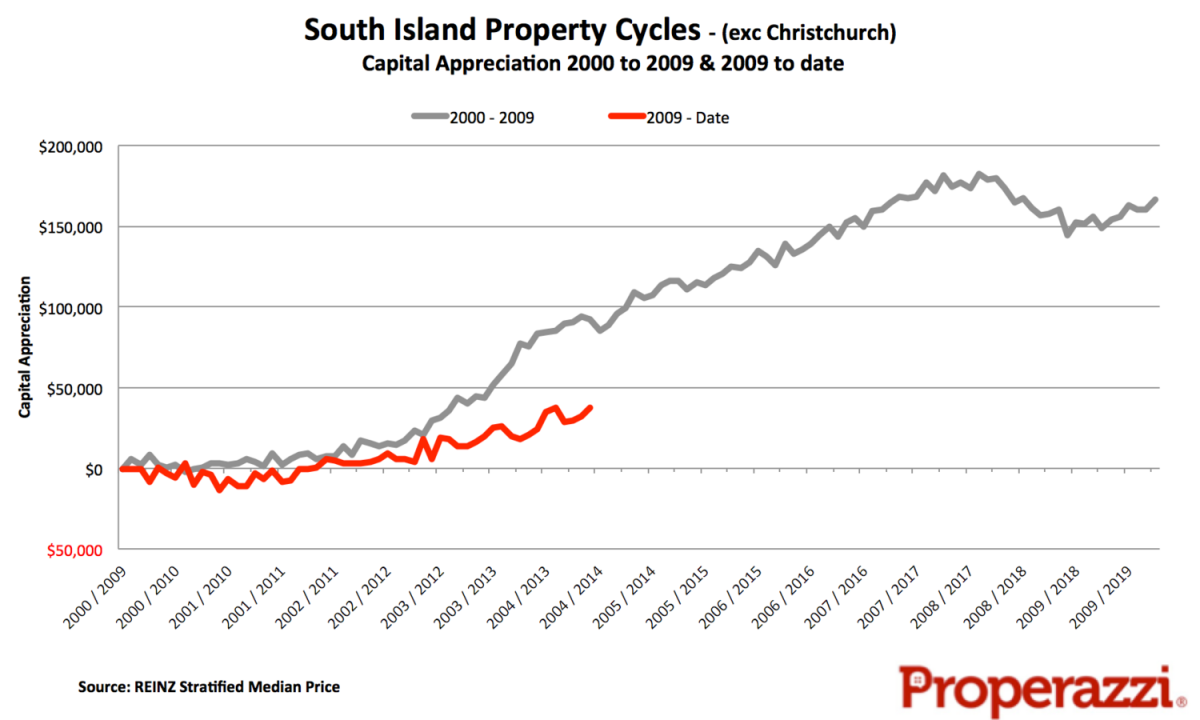
Other South Island
Excluding Christchurch from the South Island still leaves a reasonable property market with Otago as well as the Nelson / Marlbourgh region, the balance of the vast Canterbury region and of course Central Otago comprising that unique market of Queenstown. This aggregation of provincial South Island has benefited somewhat better in the past four and a half years than their North Island counterparts recording a capital appreciation of the median sales price of $37,426; after the same period at the start of the last decade it was $92,550. Clearly this region enjoyed a strong bull market in the past bull run, this time however the markets seem more subdued.
What do you think? Should the National govt press ahead with RMA reform to resolve the housing crisis? Click here to vote in our subscriber-only business pulse poll.
Former Realestate.co.nz CEO Alistair Helm is founder of Properazzi.
Alistair Helm
Sat, 24 May 2014
Sat, 24 May 2014
© All content copyright NBR. Do not reproduce in any form without permission, even if you have a paid subscription.
Free News Alerts
Sign up to get the latest stories and insights delivered to your inbox – free, every day.
Free News Alerts
Sign up to get the latest stories and insights delivered to your inbox – free, every day.
Housing Crisis or Property Bubble - what does the data tell us?
38294