
Annual NZ ad spend - TV passes newspapers, but internet rising fast
New figures show television captured the most advertising spending in 2011, pushing newspapers into second place - but that the internet is fast closing in on both.
New figures show television captured the most advertising spending in 2011, pushing newspapers into second place - but that the internet is fast closing in on both.
New figures show television captured the most advertising spending in 2011, pushing newspapers into second place - but that the internet is fast closing in on both.
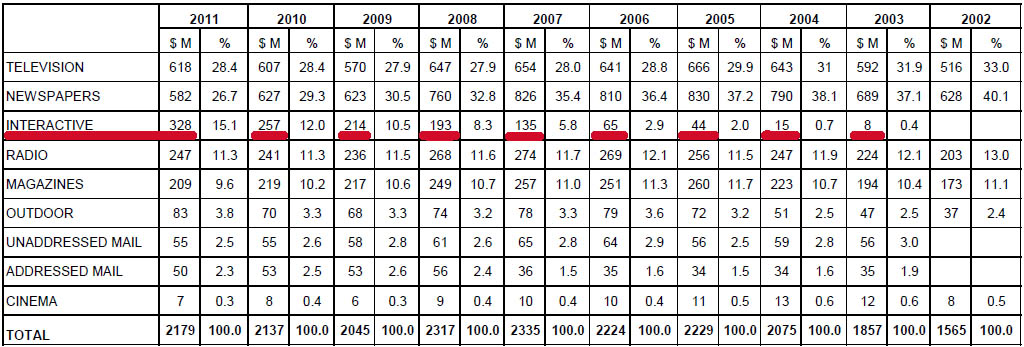
The Advertising Standards Authority says TV accounted for 28.4% of total advertising spend during 2011, but with scant year-on-year growth ($618 million to 2010's $607 million).
Newspaper's hold on to number two, at 26.7%, but with its spend dropping from last year's $627 million to $582 million.
Online (interactive) ads, by contrast, continue their explosive growth.
In 2010, the new media moved ahead of radio.
In 2011, online consolidated its lead over radio as revenue jumped from $257 million (12% of total ad spend) to $328 million (15.1%).
With new media rising faster than old media is falling, total ad spending increased slightly in 2011 to $2.179 billion, the ASA says.
The bad news - at least for mainstream media involved in online - is that search ads (hello, Google) still account for the majority of spending in the new medium.
NEW ZEALAND ADVERTISING INDUSTRY TURNOVER 2012
Click table to enlarge.
Explanatory notes for the year ended December 31, 2011
Television:
This figure includes all cash revenue, including agency commission, excluding GST from free to air (including Prime) and pay television. The figures are independently collected for ThinkTV and reported to the ASA as a total revenue figure.
Newspapers:
This figure includes all cash revenue, including agency commission, excluding GST from all daily, Sunday and community newspaper titles in New Zealand. The revenue includes display, retail, classified and insert advertising. The figures are sourced from the member newspapers of the Newspaper Publishers’ Association of New Zealand and the Community Newspapers Association of New Zealand. NOTE: Newspapers advise the figure reported is not a comparative measure with other main media which derive the majority of their revenue from National and Retail advertising sources.
Interactive:
The online advertising expenditure figure is based on gross amounts charged to advertisers and inclusive of any applicable agency commissions. The 2011 figures include Display Advertising which includes banners, skyscrapers, rich-media, streaming advertising, email, online video and other forms of interactive Display advertising; Classifieds, which includes revenues from ads placed to buy or sell an item or service and Search & Directories Advertising which includes revenues from online Directories and search engine listings. The figures are supplied via PwC, an independent auditor on behalf of the Interactive Advertising Bureau (IAB NZ).
Radio:
This figure includes all cash revenue, including agency commission, excluding GST from members of the Radio Broadcasters Association (RBA). Actual returns comprised 99% of the total radio advertising revenue for 2011. The total also includes an estimate for non-RBA members, iwi and student radio based on direct industry knowledge and projections based on market share. The figure is sourced from the Radio Broadcasters Association.
Magazines:
This figure includes cash revenue, including agency commission, excluding GST from the majority of members of the Magazine Publishers Association (MPA). For some MPA member and non-member publications, an estimate has been made. The figure does not include revenue from classified advertising. It is estimated that MPA members represent 65% of magazine advertising revenue in New Zealand. The figure is sourced from the Magazine Publishers Association.
Outdoor:
This figure includes all cash revenue, including agency commission, excluding production, installation and GST from members of the Outdoor Media Association of NZ (OMANZ). The revenue data is independently collected for OMANZ. The figure also includes actual returns from four other companies involved in outdoor or ambient advertising.
Unaddressed Mail:
This figure includes all cash revenue excluding GST, from the letterbox media companies. These companies are Reach Media and PMP Distribution. The revenue recorded is drawn from the cost of delivery. This total represents 95 % of the unaddressed mail advertising revenue in New Zealand.
Addressed Mail:
This figure is an estimate based on the cost of delivery only. It does not include production or associated costs. It is compiled using volume and expenditure estimations from Nielsen Media Research’s MailPix system. The Nielsen estimations (at standard postage rates) are validated and adjusted using New Zealand Post’s own volume and expenditure data taking discounting into account to produce the final market revenue estimation. The figure is sourced from New Zealand Post.
Cinema:
This figure includes all cash revenue, including agency commission, excluding GST from the two major companies involved in cinema advertising in New Zealand.
Sign up to get the latest stories and insights delivered to your inbox – free, every day.
Sign up to get the latest stories and insights delivered to your inbox – free, every day.
