The US bond market – what is normal and why should we care?
ANALYSIS: US bonds are meat and veg for anyone with an investment portfolio, and SVBs collapse has refocused our attention to abnormalities.
Bonds are in the spotlight this week.
ANALYSIS: US bonds are meat and veg for anyone with an investment portfolio, and SVBs collapse has refocused our attention to abnormalities.
Bonds are in the spotlight this week.
The Silicon Valley Bank (SVB) collapse has refocused our attention to ‘abnormalities’ existing in the US bond market.
This article explores some potential answers to the question: ‘What does a “normal” US bond market look like?’
The US bond market, worth US$53 trillion, is the world’s largest. Global bond markets represent more than 50% of financial investment assets, totalling US$130tr, alongside global equities of US$125tr.
US bonds are meat and veg for anyone with an investment portfolio, with $20 billion currently invested in US bonds by KiwiSaver managers.
Let’s take a 40-year road trip analysing the US bond market’s time-adjusted risk: return values (TARRV), putting into context how this market has travelled in periods of economic downturns (recessions) and raised inflation.
Simply, it is a value reflecting the premise that the longer the term of a bond investment, and the riskier the credit risk, the higher the investment returns should be.
The US Treasury yield curve (USTYC) reflects the time series of interest rates that investors demand for US government debt. It is constructed by joining up short maturities such as the FED Funds Rate and going out as long as 30 years. Most markets use 10 years as a common long-term maturity reference. US corporate bonds have their own yield curves depending on the bond’s credit rating and are based primarily off the USTYC.
US bond market ‘abnormality’ can be defined as being when investors underestimate adequate investment return yields in both USTYC and corporate interest rate yield curves when considering TARRV due to:
Credit risk has been mispriced over the past 15 years, largely caused by central banks buying bonds at abnormal TARRV during their quantitative easing (QE) buying sprees.
First, the USTYC should be positive sloping, with 10-year treasury bond (TB) yields higher than short-term yields to reflect the basic premise that the longer the investment time duration, the higher the investment risk factor and, accordingly, investors need a higher return to compensate.
This is best illustrated by the following 50-year chart tracking the interest rate difference between US 10-year TB yields and US two-year TB yields. The larger the difference, the steeper the slope of the yield curve. Accordingly, a steeper positive yield curve better rewards investors for the time risk of the bond.
This chart clearly illustrates the occasions when the USTYC is no longer normal (positive sloping) when values occur below the 0% axis, indicating a negative sloping curve.

Over the past 40 years, the USTYC has only spent 9% of the time with a negative curve, the occasions short lived, and often anticipating economic downturns (recessions).
In TARRV language, the USTYC spends most of its life in a normal zone, offering investors a yield premium between 0.25% and 1.50% for 10-year treasury bonds, above two-year TBs.
The range has been 3.00% to -2.00%, indicating when this premium is above 1.75% it is overvaluing TARRV. The average premium is 0.90%.
This is the foundation determinant of US bond market normality and suggests that a US TB investor is getting an acceptable TARRV if the 10-year TB is yielding greater than 1.00% over the two-year TB. If the USTYC is negative, it is undervaluing the TARRV.
On March 9, 2023, the USTYC was negative, with a whopping differential of -1.03%, a significant statistical outlier occurring less than 1% of the time since 1983. It also signals that buying 10-year TBs versus two-year TBs is not optimal.
Post SVB’s collapse, it currently sits at -0.95%.
It is perhaps timely to revisit the question: what is the safest US bond investment that currently protects investors capital and provides a positive return if left to maturity?
Answer: US treasury bonds are the only investment asset that comes with a government guarantee to protect investors’ capital and the investment yield on a hold-to-maturity basis. This is why it is called risk free.
So, how do I obtain a higher yield than the US risk-free yield?
Answer: Take more credit risk and buy corporate bonds (CBs), also lengthen the investment duration.
Imagine the US TB market as a global superhighway and that a bond is a car on this investment route. This superhighway can safely accommodate millions of cars travelling at speed because the highway infrastructure is in good nick and the cars are guaranteed safe. Your US TB is guaranteed to arrive safely at your destination whether it be a two or 30-year road trip, so long as you remain on the superhighway in the same car for the duration.
Bond investors may have the risk tolerance to obtain a higher yield and want to buy a different car promising a higher yield. This decision is assisted by the use a credit rating. Obtaining a higher yield than the USTYC means they are prepared to accept a riskier road with hazards or potholes and more congestion on the investment journey. The new CB means you now have a car of varying degrees of safety quality, indicated by the credit rating WOF.
Global fund managers and institutional bond investors are usually governed by investment policies that restrict the degree of risk (car choice) to a minimum credit rating of at least investment grade (BBB-).
Investors in US CBs expect to receive a TARRV premium over and above relative US TB’s.
Credit ratings provided by rating agencies such as S&P Global Ratings, Moody’s, and Fitch assess the probability of default and capacity to repay financial obligations on bonds. They predict the default probability that your CB has in successfully completing its investment journey.
The longer the road trip, the higher the accident probability, with each CB having its starting WOF rating grade ranging from BBB- to AAA.
A BBB CB has a default probability of 0.43% for two years; however, at 10 years, this probability increases 7.5 x to 3.23%. The TARRV should reflect this by incrementally increasing, the longer the road trip.
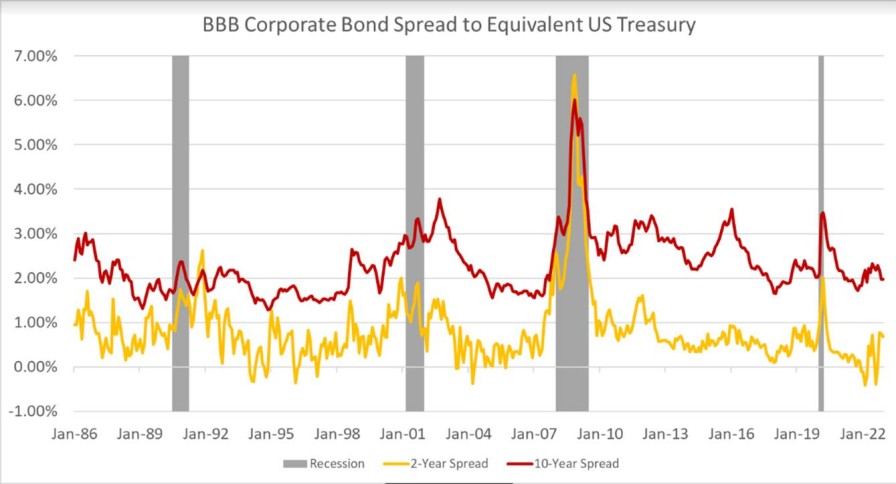
The following 40-year chart illustrates the premiums (spreads) US BBB two and 10-year CB yield above their respective US TB. The average two-year premium has been 0.60% and the 10-year average 2.00%.

Source: Ice Data Indices, LLC, ICE BofA BBB US Corporate Index Effective Yield [BAMLC0A4CBBBEY], retrieved from FRED, Federal Reserve Bank of St. Louis, March 15, 2023.
The above statistics provide us a hint at what is ‘normal’ in a CB market, ie, a positive yield curve. Over the past 40 years, the US BBB CB curve has spent most of its life (82%) between 1.20% and 2.00%, with an average reward premium of 1.50%. The range has been -0.50% and 2.75%.
A sound starting point on determining CB market normality might begin with the 10-year BBB CB yielding a premium greater than 1.50% over BBB two-year CB’s.
If the US CB yield curve is negative, it is undervaluing the TARRV (warning) and, conversely, if the premium is positive by more than 2.00% it is overvaluing this risk.
On March 9, this premium was only 0.40% (warning).
Post SVB collapse, this differential has increased to 0.70%.
The USTYC and the BBB CB yield curve are underlying constructs of the US bond market’s normal TARRV. Investors can adjust their yield expectations by increasing their risk tolerance through the credit risk profile of their bond portfolio and by extending the duration of their investment.
Merging the two data series provides logical market signals for determining optimal TARRV and warnings of bond market abnormality.
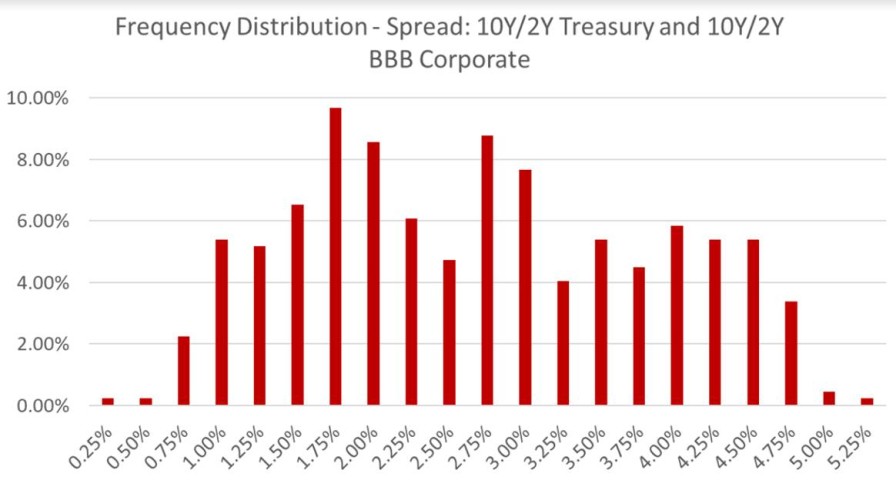
The following distribution chart illustrates an abnormal three-humped curve. The output value is the difference between BBB 10-year CB yields and the US two-year TB yield over the past 40 years.

The Y axis provides the percentage of time the X axis values have occurred. The X axis represents the BBB 10-year CB premium over the US two-year TB yield.
For 75% of the time, this premium has ranged between 1.65% and 4.75%, with an average premium of 2.56%.

Stuart Henderson.
The drivers of the USTYC (monetary policy, inflation, and economic growth) are often not in sync with drivers of corporate credit risk values, with recessions often leading to credit flights to quality, causing blow-outs in corporate premiums, while underlying US treasury bond yield curves are flat to negative, seeking to improve economic growth through central bank monetary policy actions.
On March 9, the merged TARRV premium was 0.65%, warning us that the US bond market is abnormal and is not providing adequate TARRV for long-dated CBs.
TARRV is currently not evident in the US bond market and it has not been giving bond investors true value for money for some time. Unless BBB 10-year CB premiums really blow out to offset the underlying USTYC discount, the long-term US bond market looks pretty unattractive to habitual hold-to-maturity bond investors.
The week leading up to SVB’s collapse, its Moody’s credit rating was Baa (BBB+). The current US bond market TARRV premium has increased to 1.85% (the cusp of normality). This has been caused by the combination of a sharp fall in US two-year TBs and an increase in US BBB 10-year CBs as the market watches the racetrack for more bank crashes.
This all makes the US bond TARRV value proposition even more abnormal, screaming out signals that one should keep cash short (less than 12 months) and safe, letting the bond traders play dodge car on their bond roadie.
Stuart Henderson is an independent financial market risk adviser with more than 35 years’ experience, including as a partner at PwC.
This is supplied content and not commissioned or paid for by NBR.
Sign up to get the latest stories and insights delivered to your inbox – free, every day.